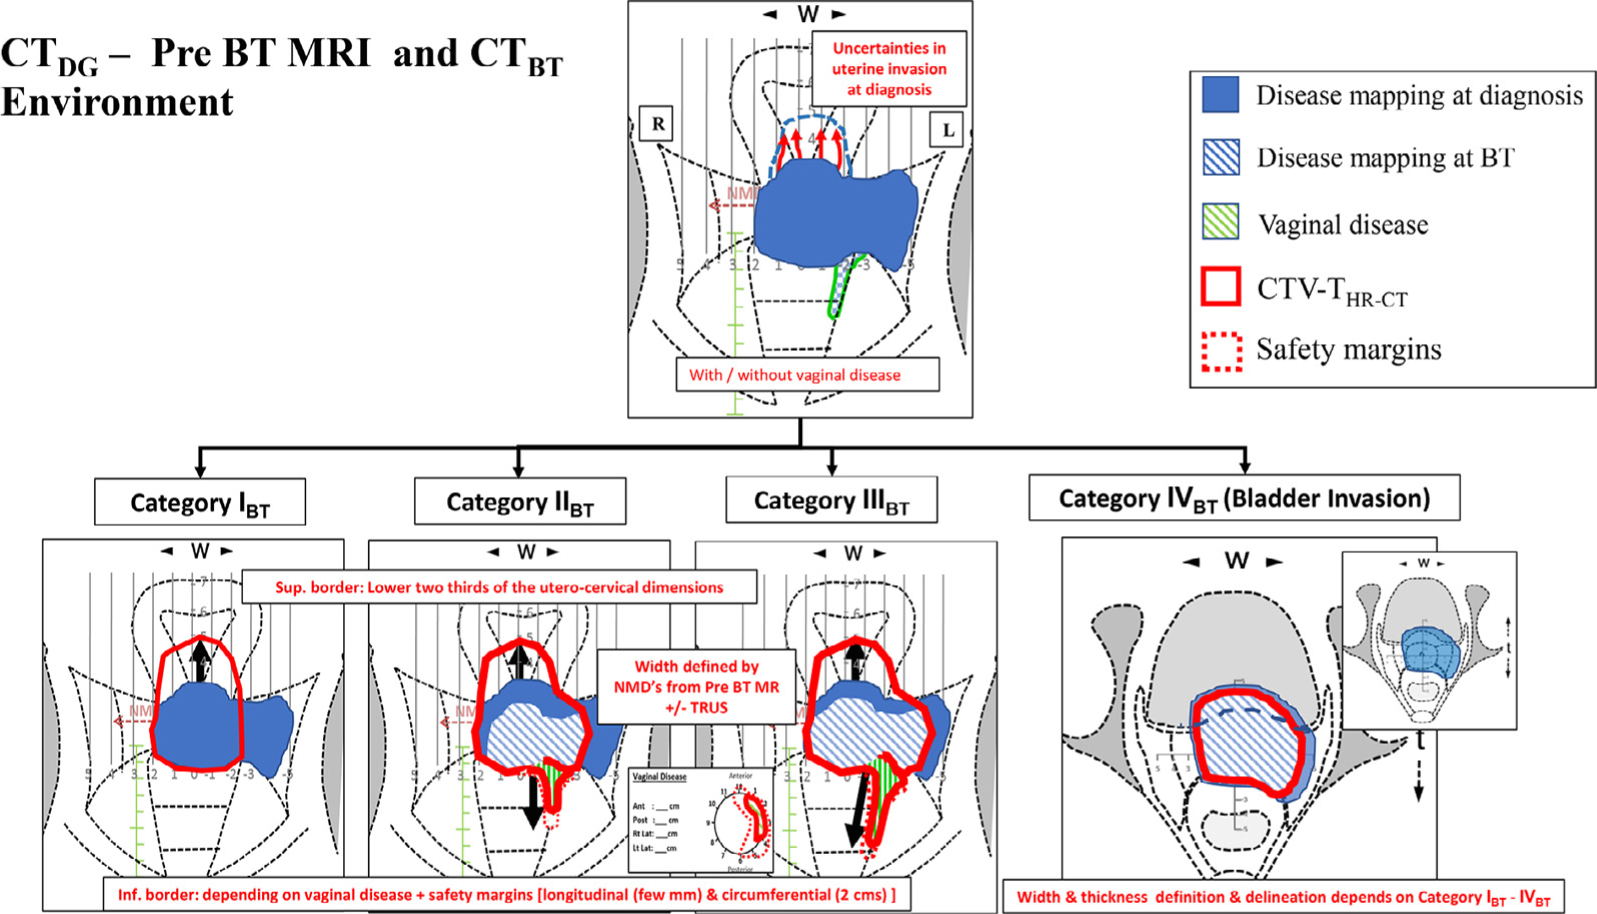
Fig. 4.

Schematic diagram showing definition of CTV- THR-CT for CTDG – Pre BT MRI and CTBT Environment. Based on the disease at diagnosis (cervix and parametrium in blue fill & vaginal disease in green lines), residual disease at BT (blue oblique lines), CTV-THR (in red continuous lines) and safety margins (red dotted lines).
