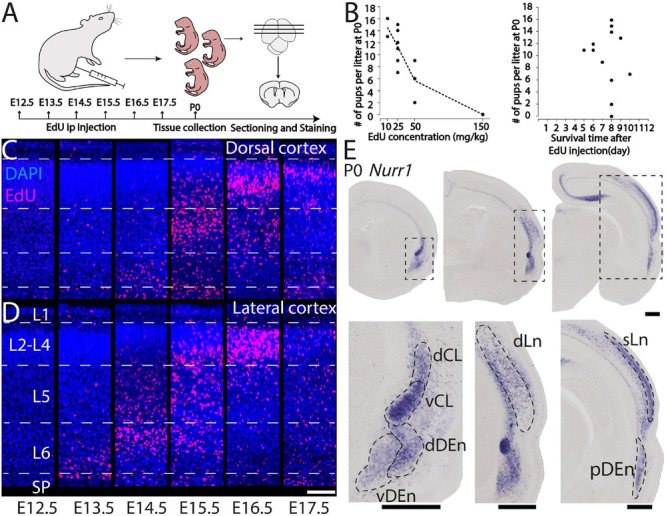
FIGURE 1.

Overview of technical approach. (A) Schematic diagram of EdU injections in pregnant rats from E12.5 to E17.5, followed at P0 by tissue collection, microtomy, and staining. (B) Relation of P0 rats survival rate with EdU concentrations and (left graph), and with survival time after EdU injection (right graph). EdU labeled P0 dorsal (C) and lateral (D) cortical sections from E12.5 to E17.5 injections. (E) Nurr1 expression in P0 sections from anterior to posterior, and magnified Nurr1 labeled regions including, dCL (dorsal claustrum), vCL (ventral claustrum), dDEn (dorsal DEn), vDEn (ventral DEn), dLn (deep layer neurons), sLn (superficial layer neurons), and pDEn (posterior DEn). Scale bar in panels (C,D) = 100 μm. Scale bar in panel (E) = 0.5 mm.
