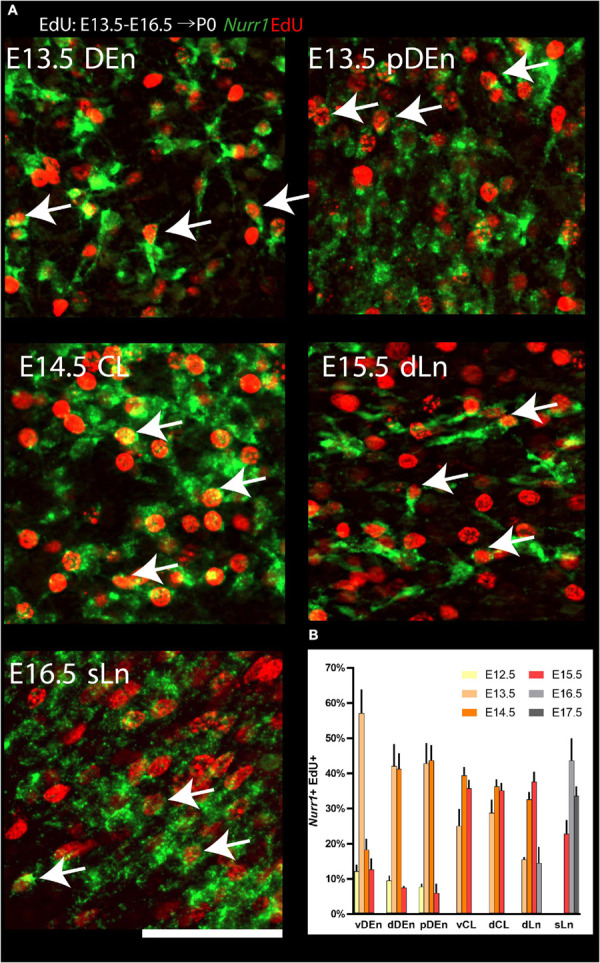
FIGURE 12.

Quantification of Nurr1 + EdU + double positive cells. (A) Examples of cell level overlapping of Nurr1 and EdU in all Nurr1 labeled claustrum regions, including DEn, pDEn, CL, dLn and sLn. (B) Quantification of Nurr1 + EdU + populations born at E12.5 to E17.5 in Nurr1 labeled regions including, dDEn, vDEn, pDEn, vCL, dCL, dLn, and sLn. Bars represent mean ± standard deviation. N = 3 brains for each date (3 sections from each brain). Scale bar in panel (A) = 100 μm.
