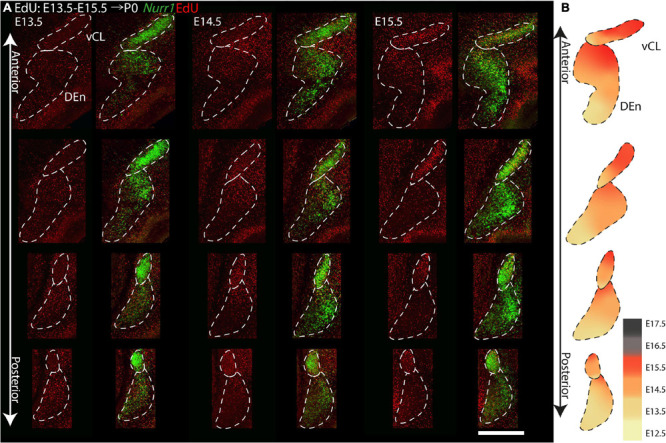
FIGURE 13.

Gradients of neurogenesis in the Nurr1 labeled CL and DEn from anterior to posterior. (A) High magnification Nurr1 labeled posterior claustrum related regions, including CL and DEn with E13.5 to E15.5 EdU labeling. (B) Schematic diagram of the CL and DEn. EdU signals in different regions from E12.5 to E17.5 shown as indicated by the color bar. Scale bar in panel (A) = 0.5 mm.
