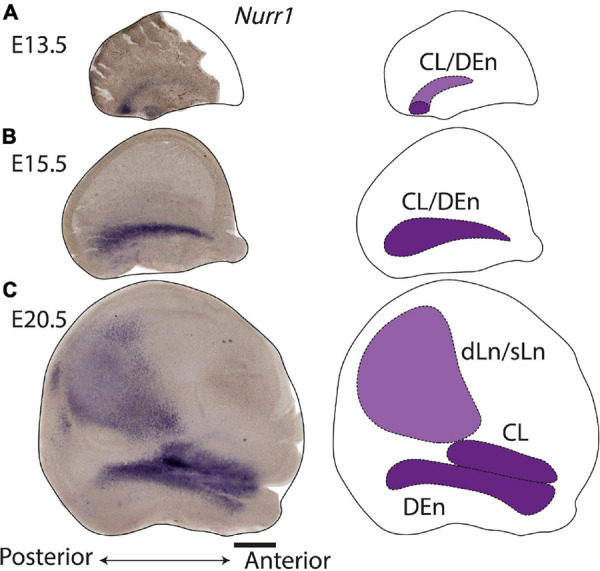
FIGURE 14.

Overview of claustrum development. Flattened cortex and schematic diagram of Nurr1 expression by in situ in E13.5 (A), E15.5 (B), and E20.5 (C). One hemisphere was flattened and sectioned into 100 μm sections. Multiple sections were overlayed in panels (B,C). Scale bar in panel (A) = 1 mm.
