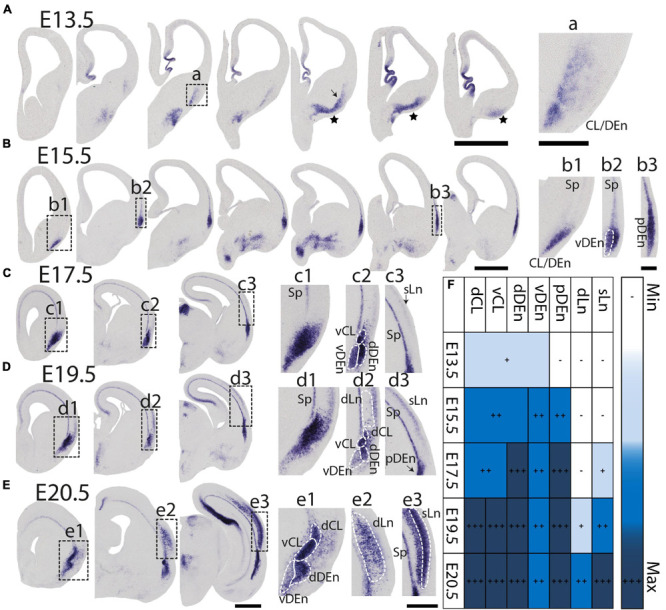
FIGURE 2.

Prenatal development of Nurr1 expression. Nurr1 expression on E13.5 (A), on E15.5 (B), on E17.5 (C), on E19.5 (D) and on E20.5 (E). High magnification Nurr1 labeled regions from E13.5 to E20.5 (a–e), including the CL/DEn on E13.5, the Sp, vDEn, and pDEn on E15.5, the sLn on E17.5, the dLn, vDEn, dDEn, vCL and dCL on E19.5, and all sub-regions on E20.5. (F) Table of prenatal development of Nurr1 expression. White and “–” indicate no expression, light blue and “ + ” indicate beginning Nurr1 expression, higher expression is shown in darker color and more “ + ” signs. N = 2 rats for each date. Scale bars in panels (A–E) = 1 mm. Scale bars in panels (a–b) = 200 μm. Scale bars in panels (c–e) = 500 μm.
