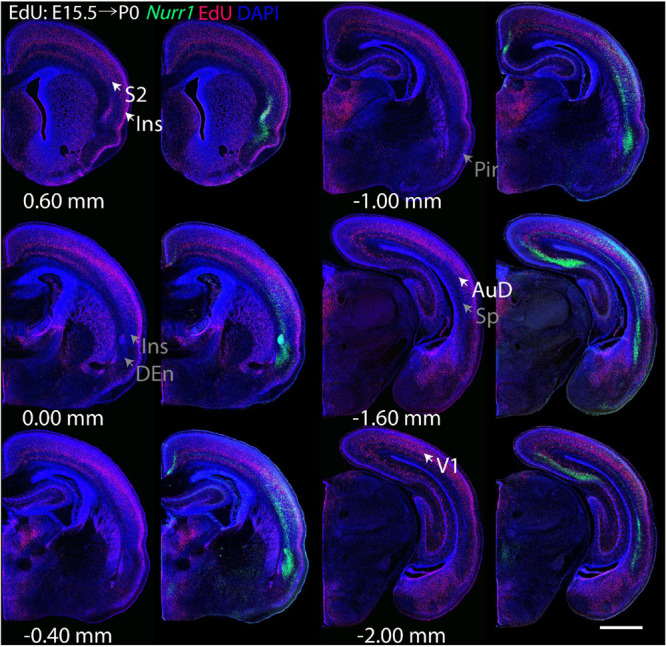
FIGURE 7.

Overview of EdU labeling on E15.5 with Nurr1 FISH on P0. White arrows indicate the EdU labeled regions. Gray arrows indicate the regions with reduced EdU labeling. S2, secondary somatosensory cortex, AuD secondary auditory cortex, V1 primary visual cortex dorsal area, DEn, dorsal endopiriform nucleus, Ins, insular cortex, Pir, piriform cortex, Sp, subplate. Numbers below sections indicate the bregma coordinate. N = 3 rats. Scale bar = 1 mm.
