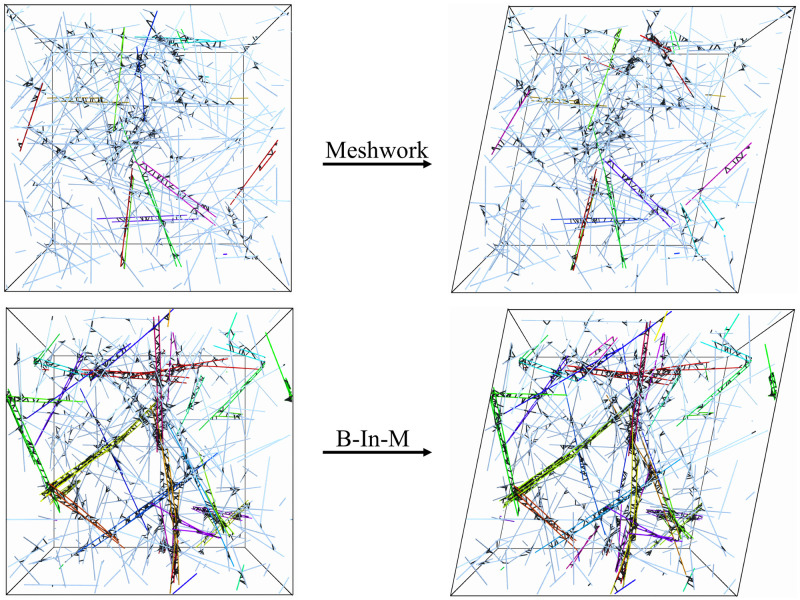
Fig 3. Snapshots from the stress relaxation test in a homogeneous meshwork (top) and B-In-M geometry (bottom).
We begin with an unsheared unit cell at left, then shear the network until it reaches a maximum strain (20% in this case, shown at right), after which we turn off the shear and measure the relaxation of the stress. As in Fig 2, the colored fibers are in bundles, and the CLs are shown in black. For the B-In-M geometry, these snapshots are from a smaller domain (Ld = 2 μm) than we typically use so that we can also see the CLs.

