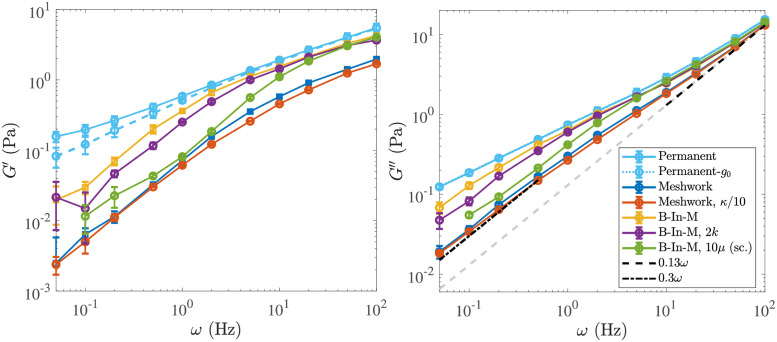
Fig 5. Elastic (left) and viscous (right) modulus for the five systems we study.
The system parameters are described in Tables 1 and 2 (see Table 2 for what parameters are varied in each system). For the B-In-M morphology with ten times the viscosity (μ = 1 Pa ⋅ s), we show the data with time rescaled by a factor of ten. We also show the results for permanently-cross-linked networks, and for the elastic modulus the dashed light blue curve is the remaining elastic modulus when g0 ≈ 0.07 Pa (measured in Fig 4) is subtracted off.

