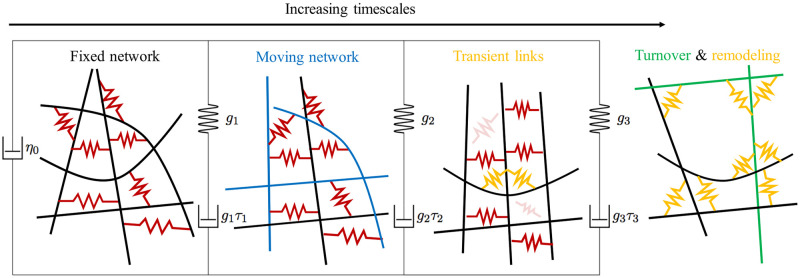
Fig 10. Our continuum model, informed by the timescales discussed in previous sections.
We use three Maxwell elements with timescales τ1, τ2, and τ3, all in parallel with a viscous dashpot to describe the network. The viscous dashpot η0 represents the high frequency viscosity of the permanently cross-linked fiber suspension. The first Maxwell element has timescale τ1 ≈ 0.02 seconds associated with it, and represents the relaxation of the fibers to a transient elastic equilibrium (the networks before and after relaxation are shown to the left and right of this Maxwell element; the relaxing fibers are shown in blue); on this timescale, the links are effectively static. The second Maxwell element, with timescale τ2 ≈ 0.5 s, represents the unbinding of some links (shown more transparent than the others) and the appearance of new links (orange) − compare the networks to the left and right of this Maxwell element. The third Maxwell element with timescale τ3 ≈ 5 s represents network remodeling (compare the networks to the left and right of this element); for timescales larger than τ3, some of the fibers (shown in green) and links (orange) turn over and the network completely remodels from the initial state.

