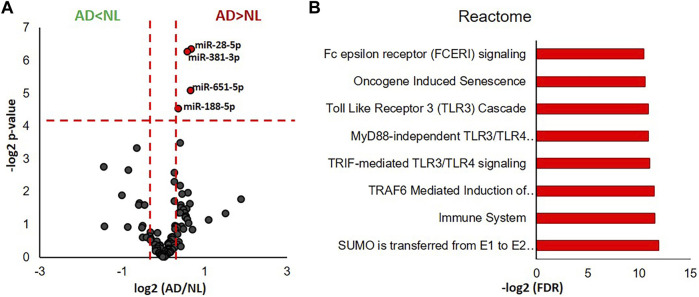
FIGURE 3.
miRNA transcriptomic analysis of microglial EVs from normal/low pathology and late-stage AD cases. (A) Volcano plot showing a degree of differential expression of miRNAs in NL and AD groups. Vertical red dotted lines separate miRNA, which are 1.5 or more times less abundant in AD (far left segment) and 1.5 or more times more abundant in AD (far right segment). Horizontal red dotted line separates the top section of the plot containing dots representing proteins whose abundance is significantly different between NL and AD groups (*p < 0.05). MicroRNAs, which are significantly different between AD and NL groups, are color-coded: 1.5 or more times more abundant in AD are presented in red, 1.5 or more times less abundant are in green. (B) Gene ontology enrichment bioinformatic analysis of miRNAs significantly more abundant in AD compared to NL.

