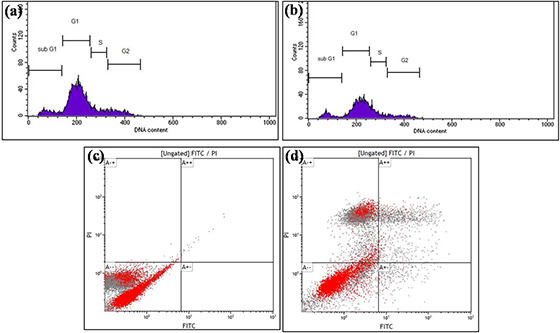
Fig. 6.

Cell cycle assay obtained with GK‐(Ag–Au)NPs
(a) Untreated, (b) Cells treated with 5 µg L−1 GK‐(Ag–Au)NPs for 48 h. GK‐(Ag–Au)NPs treated B16F10 cell lines were stained with propidium iodide (PI) and cellular DNA content frequency histograms were obtained. The histogram depicts that the subG1 cell population has been enhanced to about 10.47% on treating with GK‐AuNPs. Apoptotic assay with FACS analysis (c) Untreated, (d) Cells treated with 5 µg L−1 GK‐(Ag–Au) NP for 48 h. In case of apoptotic assay, the early apoptotic phase contained 1.77% of cells while in late apoptotic phase there were around 7.11% of cells on treatment with GK‐(Ag–Au) NP
