
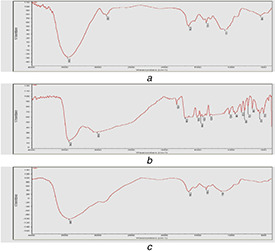
Fig. 2.
FTIR analysis
(a) Ferulic acid, (b) Chitosan, (c) FANPs, recorded in the range of 500–4500 cm−1 at a resolution of 1 cm−1 showing the shift of identical absorption peaks corresponding to change in chemical groups during the encapsulation of ferulic acid into chitosan nanoparticles