Fig. 3.

TEM images of
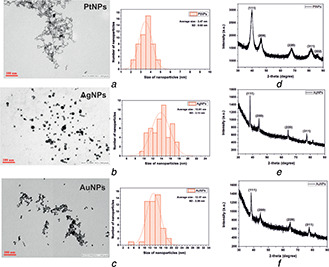
(a) PtNPs, (b) AgNPs, (c) AuNPs showed the average sizes of sub‐15 nm along with histogram for mean size distribution measurement, (d) , (e) , (f) Crystal structure of PtNPs, AgNPs and AuNPs was measured using XRD

TEM images of
(a) PtNPs, (b) AgNPs, (c) AuNPs showed the average sizes of sub‐15 nm along with histogram for mean size distribution measurement, (d) , (e) , (f) Crystal structure of PtNPs, AgNPs and AuNPs was measured using XRD