Fig. 3.

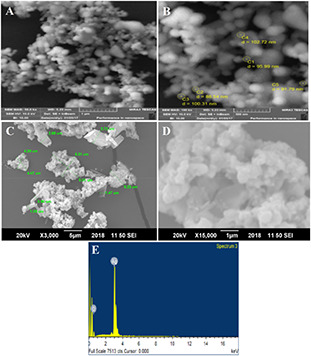
SEM images of AgO2 NPs and drug loaded AgO2 NPs at different magnifications and Energy dispersive X‐ray analysis of AgO2 ‐NPs
(A, B) SEM images of AgO2 NPs, (C, D) SEM images of drug loaded AgO2 NPs, (E) Energy dispersive X‐ray analysis of AgO2 ‐NPs
