
Fig. 6.
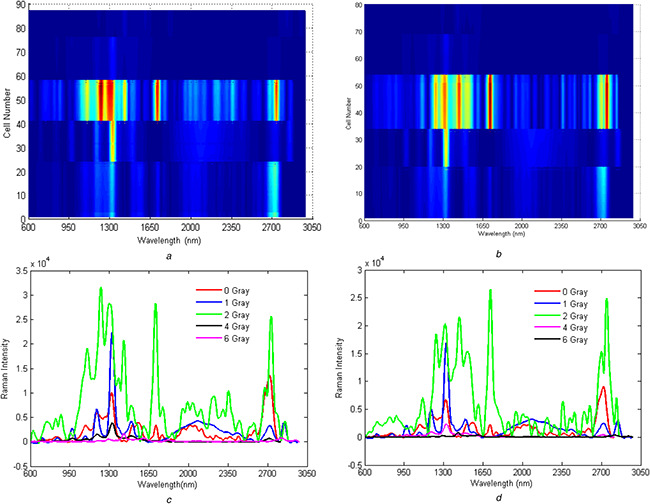
Two‐dimensional counterplot of Raman spectroscopy in the presence of Silver nanoparticle‐AB
(a) 24 h post‐irradiated, (b) 48 h post‐irradiated. The number of cells irradiated with various doses of the gamma ray is presented on the left side of the panel, (c) Average Raman spectra for 24 h post‐irradiated, (d) Average Raman spectra for 48 h post‐irradiated cells