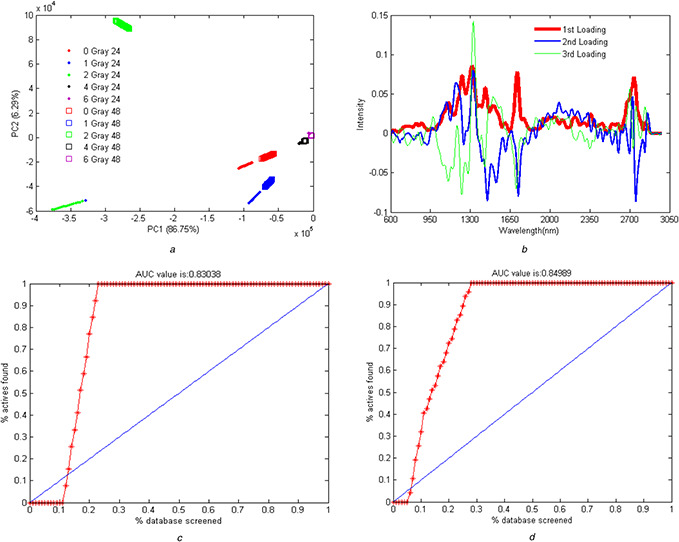
Fig. 8.

Raman spectroscopy data analysis
(a) PCA score of isolation of the 24 and 48 h post‐irradiated samples from each other, (b) Loading profile for the 24 and 48 h post‐irradiated samples in the presence of the drug, (c) Frequency repetition profile of the best wavelength for the separation of the 24 and 48 h post‐irradiated samples, (d) ROC analysis for the separation of the 24 form the 48 h post‐irradiated sample (left) and vice versa (right)
