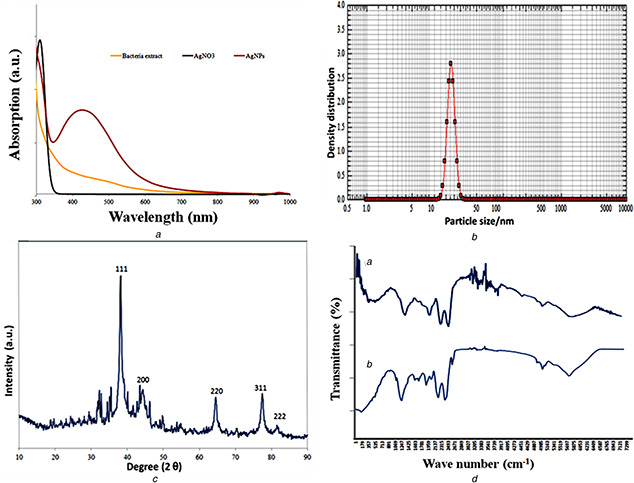
Fig. 3.

Characterisation of silver nanoparticles synthesised from the extract of M. lipolyticus
(A) UV‐visible spectrum a 423 nm, (B) Nanophox particle size analysis −15.6 nm, (C) XRD graph showing crystalline of silver particles, (D) FTIR spectra showing the involvement of functional group in particles formation
