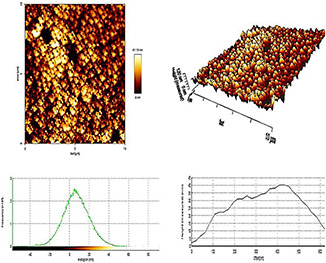
Fig. 3.

2D (above) and 3D (middle) AFM images and graphs (below) of PEG‐citrate dendrimer‐G2. Blue Plots compare the height (Y‐axis) to offset (X‐axis) measurements (nm) of the dendrimer. The Green Histograms show the frequency. The peak‐to‐valley roughness Rt of the dendrimer G2 is 14.5 nm and the physical size is 10 × 10 nm
