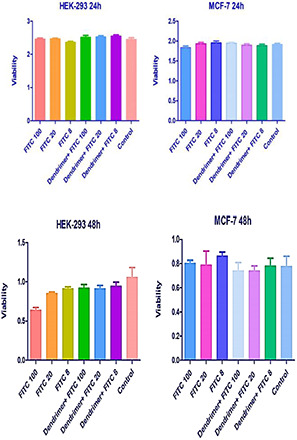
Fig. 4.

MTT diagrams of free FITC and dendrimer‐G2 ‐FITC complex on HEK‐293 and MCF‐7 cells. Data are presented as mean ± SEM. Based on statistical analyses, only 100 µM concentration of free FITC had significant differences in anti‐proliferation from the untreated control cells. The similar concentrations of dendrimer‐G2 ‐FITC showed no toxicity on HEK‐293 (p value <0.05, n = 3)
