. 2021 Oct 5;10:e67397. doi: 10.7554/eLife.67397

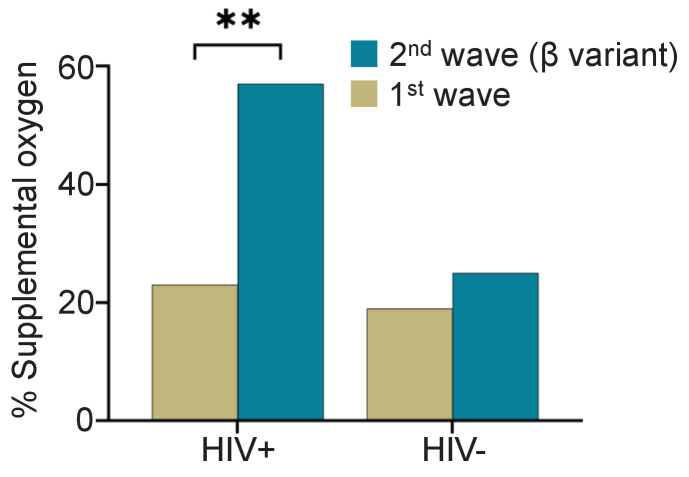
Figure 1. Fraction of PLWH and HIV-negative participants requiring supplemental oxygen during the first and the Beta variant dominated second infection waves.

p=0.0025 by Fisher’s Exact test.

Figure 1.

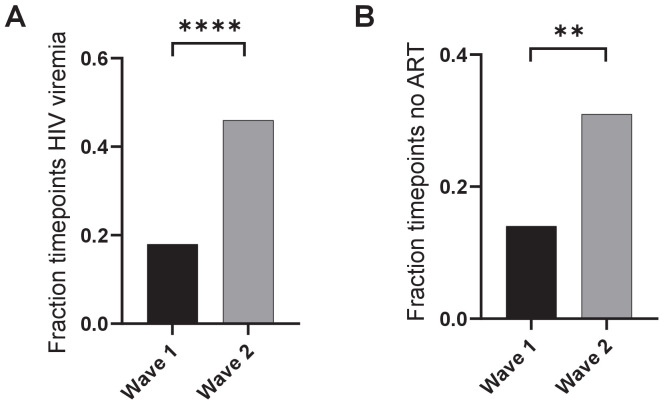
Figure 1—figure supplement 1. Viremia and ART in PLWH in wave 1 versus wave 2.

Figure 1—figure supplement 1.

(A) HIV viremia was calculated as the number of study timepoints in wave 1 or wave 2 with HIV RNA > 200 copies/ml divided by all measured timepoints for PLWH. (B) The fraction of timepoints with no detectable ART was calculated as the number of study timepoints in wave 1 or wave 2 where the concentration of none of the ART components was above level of quantification divided by the number of timepoints where ART was measured. p-values are * <0.05; ** <0.01; *** < 0.001, **** < 0.0001 as determined by Fisher’s Exact test.
Figure 1—figure supplement 2. Effect of ART regimen on disease severity.
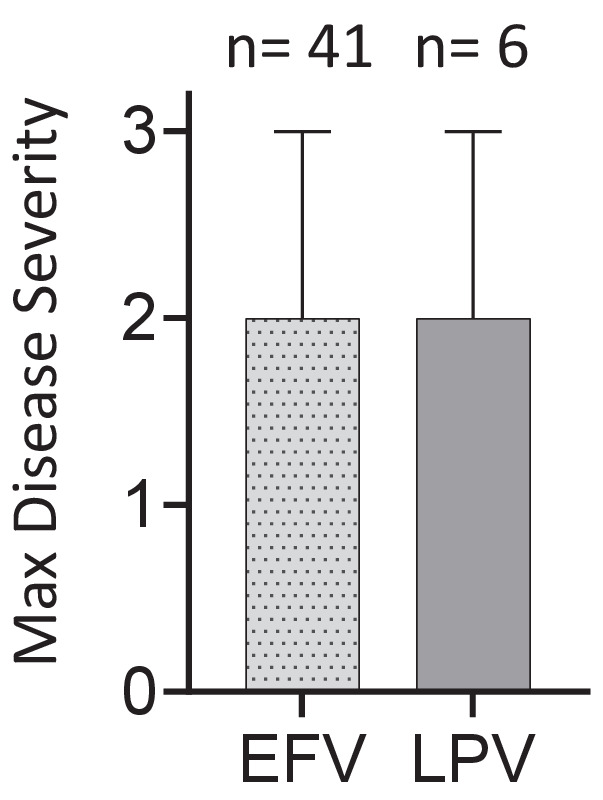
Figure 1—figure supplement 2.

Disease severity was scored on a 3 point scale, where 1: asymptomatic, 2: mild, and 3: supplemental oxygen or death. EFV: efavirenz-based regimen. LPV: Lopinavir based regimen.
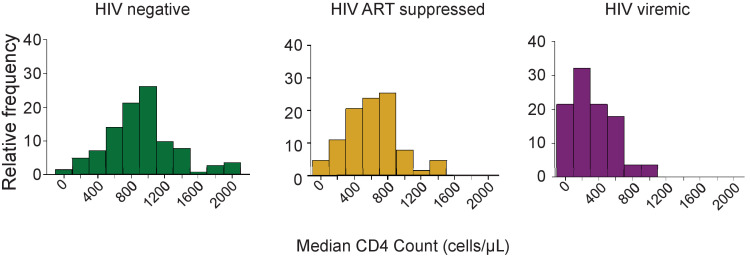
Figure 1—figure supplement 3. Distribution of CD4 counts by HIV status.

Figure 1—figure supplement 3.

Plotted are the CD4 T cell count distributions for HIV negative, HIV ART suppressed, and HIV viremic participants. X-axis is the median CD4 count over all study visits, and y-axis is relative frequency of participants as percentage.
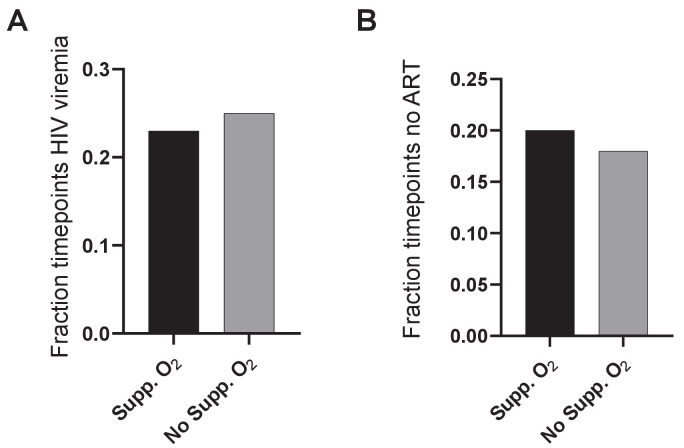
Figure 1—figure supplement 4. Viremia and ART in PLWH requiring versus not requiring supplemental oxygen.

Figure 1—figure supplement 4.

(A) HIV viremia was calculated as the number of study timepoints with HIV RNA > 200 copies/ml divided by all measured timepoints for PLWH. (B) The fraction of timepoints with no detectable ART was calculated as the number of study timepoints where the concentration of none of the ART components was above level of quantification divided by all measured PLWH timepoints. No significance for comparison in (A) or (B) as determined by Fisher’s Exact test.
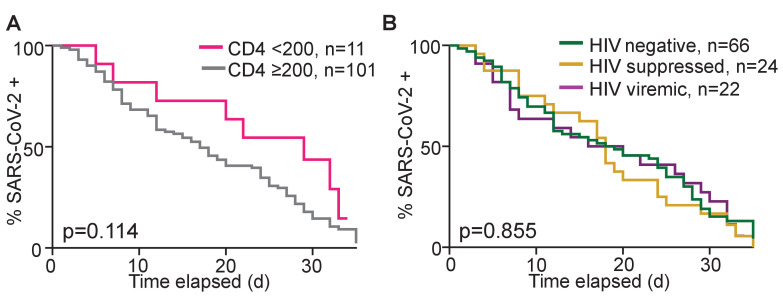
Figure 1—figure supplement 5. Dependence of time to SARS-CoV-2 clearance on CD4 count and HIV status.

Figure 1—figure supplement 5.

(A) Number of participants remaining SARS-CoV-2 positive by qPCR with time as a function of CD4 count. (B) Number of participants remaining SARS-CoV-2 positive by qPCR with time as a function of HIV status. Time is days post-diagnostic swab. Only participants who were tested with two conclusive tests result (either SARS-CoV-2 positive or negative) during the time-period were included.