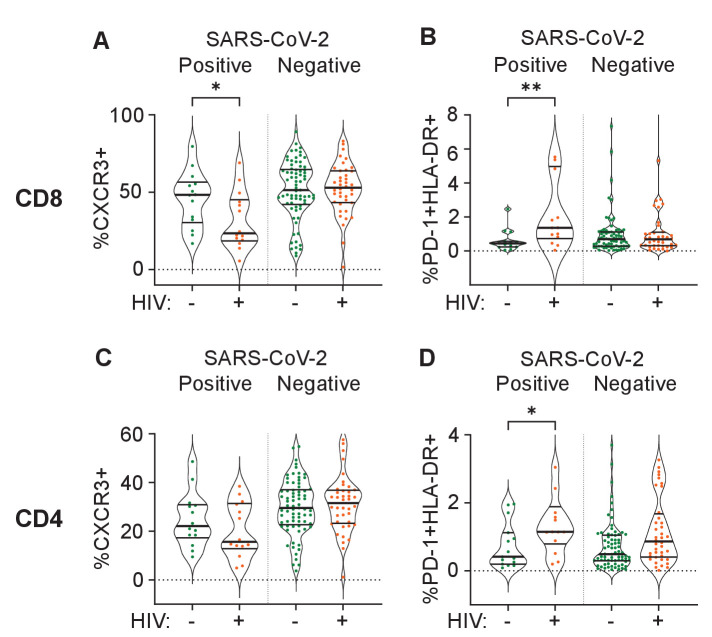
Figure 4. Differences between PLWH and HIV-negative participants in immune cell markers.
Percent of CD8 T cells positive for CXCR3 (A) or double positive for HLA-DR and PD-1 (B). Percent of CD4 T cells positive for CXCR3 (C) or double positive for HLA-DR and PD-1 (D). Data is composed of 15 participant timepoints which were SARS-CoV-2+HIV-, 14 SARS-CoV-2+HIV+, 40 SARS-CoV-2-HIV+, and 74 SARS-CoV-2-HIV-, where SARS-CoV-2+ indicates SARS-CoV-2 RNA was detected in the upper respiratory tract. p-values for differences between PLWH and HIV-negative participants are * <0.05; ** <0.01; *** < 0.001, **** < 0.0001 as determined by the Mann-Whitney U test.

