Fig. 19.

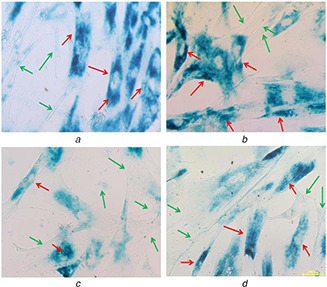
Expression of β‐gal positive cells cultured on different nanofibre membranes
(a) 12PH0, (b) 12PH0.2, (c) 12PH0.5, (d) 12PH1 at P6. The red and green arrows indicate the expression of β‐gal positive and negative cells

Expression of β‐gal positive cells cultured on different nanofibre membranes
(a) 12PH0, (b) 12PH0.2, (c) 12PH0.5, (d) 12PH1 at P6. The red and green arrows indicate the expression of β‐gal positive and negative cells