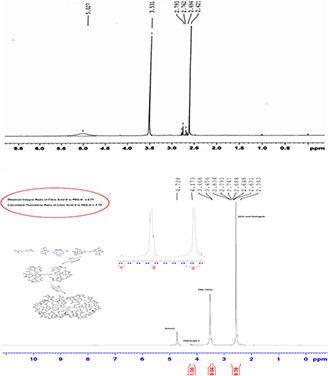
Fig. 3.

1 H NMR (500 MHZ) spectra of
(a) Dendrimer‐G2, (b) Dendrimer‐G3. Peaks around 2.7 (2J = 15.5 Hz, 2 h), 3.5 (t, 3J = 5 Hz, 2 h), and 5.02 (s, 2 h) in Fig. 3 a are related to the CH2 COOH functional group of citric acid, OCH2 CH2 and OCH2 CO functional groups of PEG, respectively
