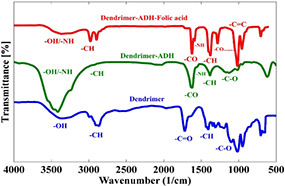
Fig. 5.

FTIR spectrum of the synthesised dendrimers. The peak located at 1232 cm−1 indicates the formation of dendrimer‐G3. The peak around 1726 cm−1 is attributed to C = O groups of terminal citric acid. The peak around 1084 cm−1 is related to the C–O functional groups of PEG. The peaks around 3500 cm−1 also are related to the OH functional groups of citric acid
