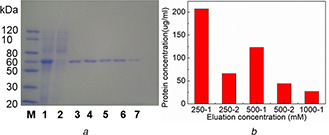
Fig. 9.

Purification of His‐tagged GFP from cell lysate
(a) SDS‐PAGE analysis of purified His‐tagged GFP by Fe3 O4 /MPS@PAA/NTA‐Ni2+ nanocomposites. Lane M, the protein molecular weight marker; Lane 1, cell lysate containing His‐tagged GFP; Lane 2, after treatment with Fe3 O4 /MPS@PAA/NTA‐Ni2+; Lanes 3–7: the fractions washed from Fe3 O4 /MPS@PAA/NTA‐Ni2+ nanocomposites with different imidazole concentration (lanes 3 and 4, 250 mM; lanes 5 and 6, 500 mM; lane 7, 1 M), (b) Concentrations of separated proteins
