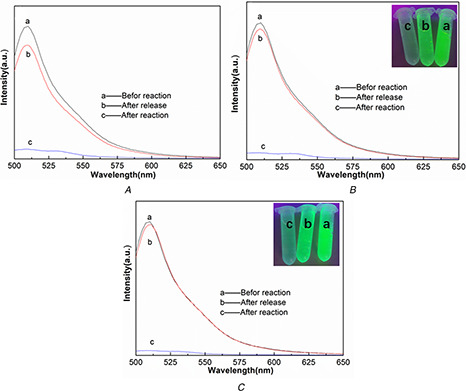
Fig. 11.

Fluorescent spectra of His‐tagged GFP showing the change of emission intensity of the solution purified with
(A) Non‐magnetic Ni‐NTA, (B) Magnetic Ni‐NTA, (C) Fe3 O4 /MPS@PAA/NTA‐Ni2+ nanocomposites. (a) Before and (b) After reaction with beads, (c) Released His‐tagged GFP in imidazole solution
