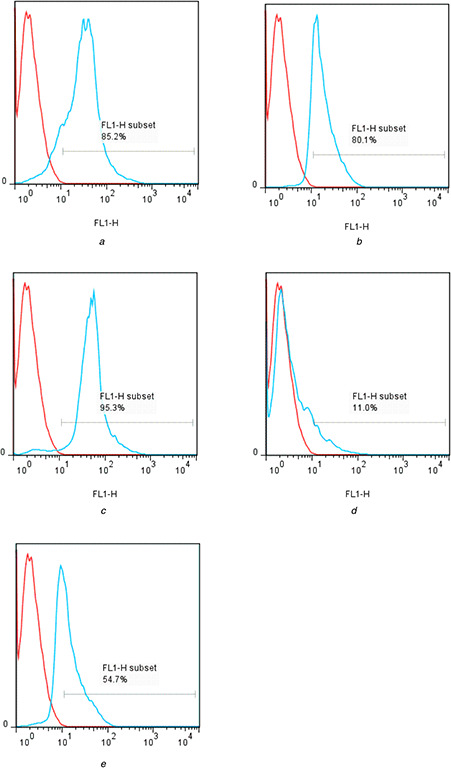
Fig. 8.

Flow cytometry analysis of E‐GFP plasmid gene expression in HeLa cell transfected with
(a) Metafectene®, (b) MCM‐41‐Im, N /P = 0.5, (c) MCM‐41‐Im, N /P = 1, (d) MCM‐41‐NH2, N /P = 0.5, (e) MCM‐41‐NH2, N /P = 1 (blue lines) versus negative control cells (red lines)
