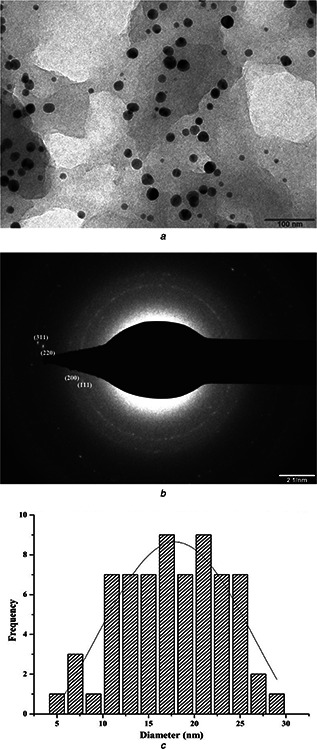
Fig. 4.

Representative TEM micrograph of the synthesised silver NPs and typical SAED pattern of silver NPs
a TEM of the synthesised silver NPs. Scale bar corresponds to 100 nm
b SAED pattern of silver NPs. Scale bar corresponds to 2 nm
c Histogram showing particle size distribution of the silver NPs
