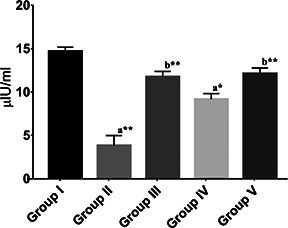
Fig. 3.

Serum Insulin levels of different groups expressed in μIU/ml. Values are mean±SEM, n = 6, * = p < 0.05, ** = p < 0.01. Statistical analysis – ANOVA followed by Tukey's comparison test. a = comparison of group I with other groups and b = comparison of group II with other groups
