
Figure 3.
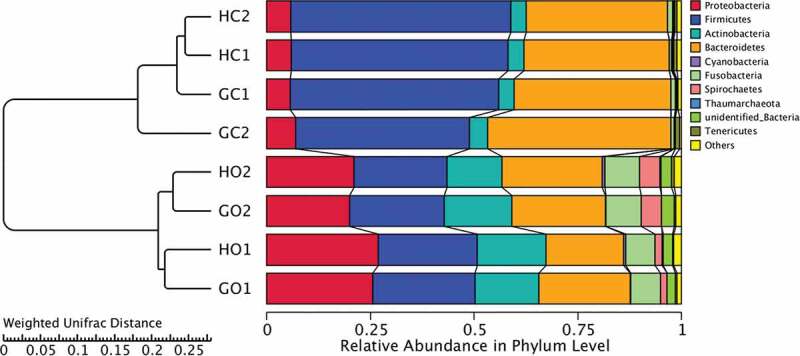
UPGMA analysis based on weighted UniFrac distances with the result of the clustering tree shown on the left and the distribution diagram of the top 10 phylum abundances shown on the right. GC1: GDM. intestinal, GC2: periodontitis+GDM. intestinal, HC1: healthy control. intestinal, HC2: periodontitis. intestinal, GO1: GDM. oral, GO2: periodontitis+GDM. oral, HO1: healthy control. oral, HO2: periodontitis. oral. Comparisons of community structures among groups were performed using AMOVA analysis