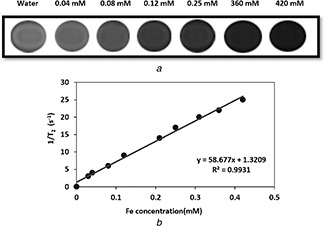
Fig. 8.

MR Image and calculated T2 relaxation rates and relaxivity
(a) T 2 ‐weighted MR image of CoFe2 O4 MNPs in water medium obtained by a conventional spin‐echo pulse sequence on a 1.5 T MRI system, (b) T 2 relaxation rates (1/T 2) depending on the concentration, calculated T 2 relaxivity (r 2) at various Fe concentrations of (0.03 to 0.42 mM)
