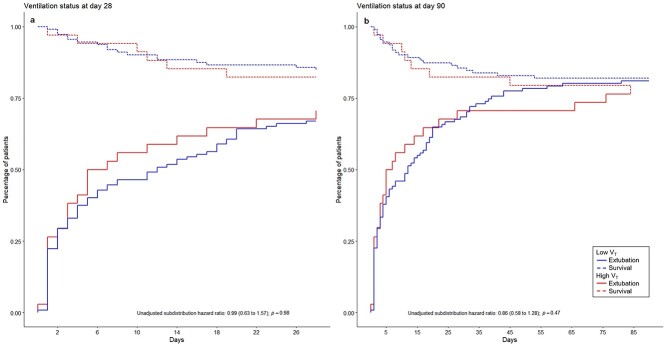
Figure 3.
Cumulative incidence curves for ventilation status of patients ventilated with low vs high tidal volume size at day 28 and day 90. Sub-distribution hazard ratio: the magnitude is affected by both time to extubation and probability of death; calculated using the Cox proportional hazard model. (a) Ventilation status at day 28, (b) ventilation status at day 90. VT tidal volume

