
Figure 2.
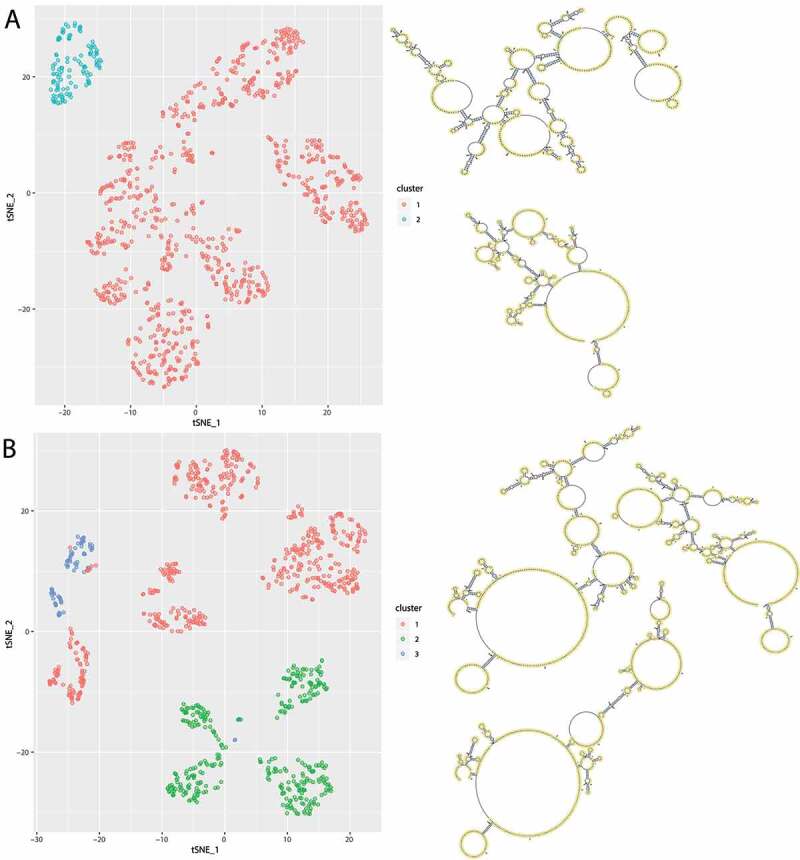
Visualization of the structural ensemble taking the SHAPE-seq data into account. For this 1000 structures were sampled from the Boltzmann distribution, that were coloured by their optimal cluster affiliation. t-SNE was used for dimensionality reduction and plotted in 2D. A Cluster analysis of the reference structures reveals two distinct clusters with different centroid structures. B Cluster analysis of the RiboSNitch structures reveals three distinct clusters with different centroid structures