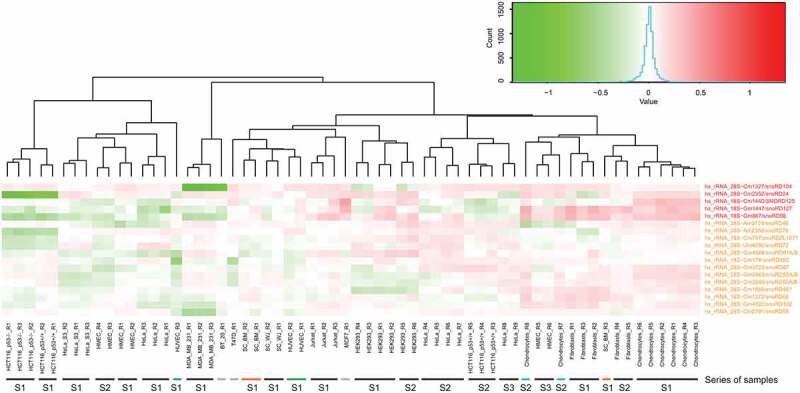
Figure 1.

Heatmap for variable and highly variable Nm positions in human rRNA. Differential heatmap shows MethScore values row-normalized to the average value for each line, positive (red) and negative (green) variations of Nm level by position are shown). The scale of MethScore variation is shown by the colour gradient (colour key). Identity of the human cell line is shown at the bottom (S indicates the series, R stands for biological replicate), type and location of the modified residues, as well as associated C/D-box snoRNA (if known) are indicated at the right. Only Nm residues from variable (orange) and highly variable (red) groups are shown. The low variable position 28S−Am2388 which clusters together with the variable group (see Figure S4), is omitted
