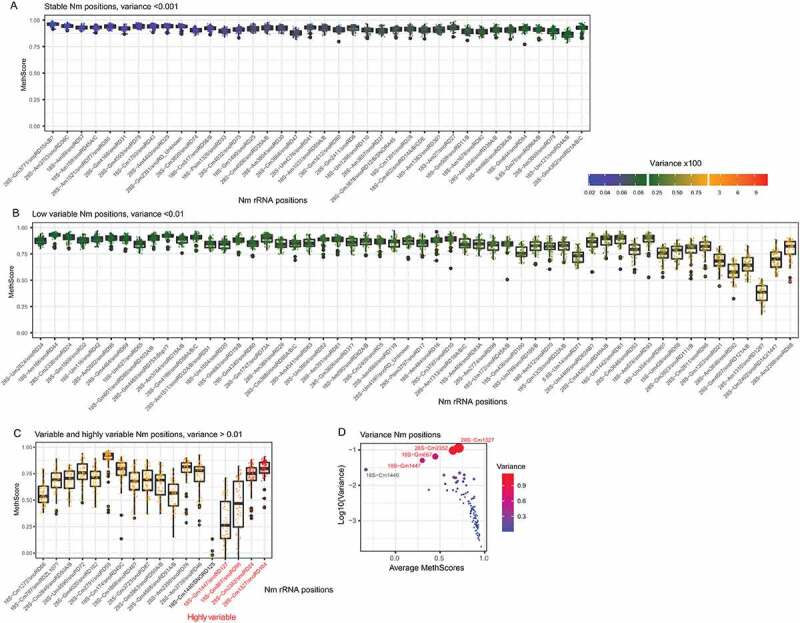
Figure 2.

Global level and variability of all known Nm sites in human rRNA across the analysed human cell lines. Positions are sorted according to the calculated variance, from lowest to highest, boxplot shows the average level of the MethScore (central bar), quartiles (box borders and whiskers) and eventual outliers (black dots). Colour scale for individual data points represents the level of the variance, the scale is shown. Panels A-C: stable, low variable and variable groups, the last five positions in the variable group show high variability (variance >0.1, highly variable). Panel D shows a scatterplot for Average MethScore (X-axis) and log10 of the variance (Y-axis), shown also by colour code and by diameter of the dots
