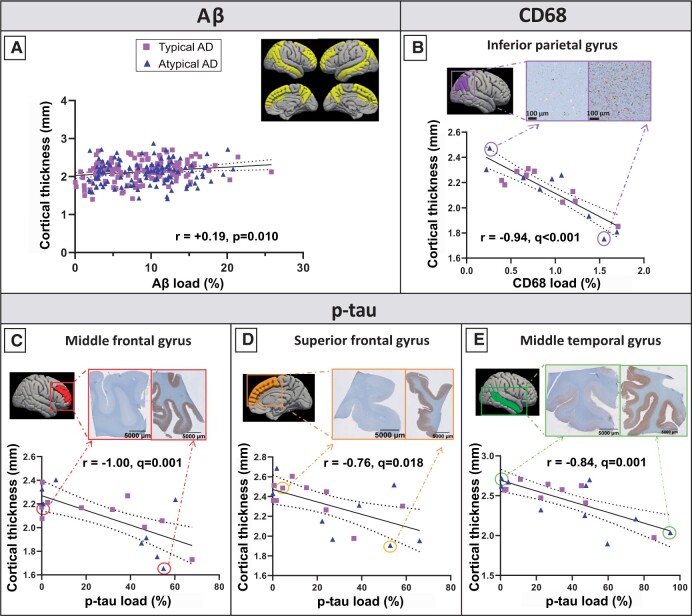
Figure 4.
MRI-pathology associations in Alzheimer’s disease. (A) Weak positive correlation between Aβ load and cortical thickness in the Alzheimer’s disease group across regions (shown in yellow). (B) Strong negative correlation between reactive microglia load and cortical thickness in the inferior parietal gyrus. (C) Strong negative correlations between p-tau load and cortical thickness in the middle frontal gyrus, (D) superior frontal gyrus and (E) middle temporal gyrus. On the top right of each graph, two tissue sections representing a low (left) and high (right) pathological load are shown. Purple squares represent typical Alzheimer’s disease cases, and blue triangles atypical cases. A fit-line with 95% confidence interval (dashed lines) is shown for each correlation. AD, Alzheimer’s disease.

