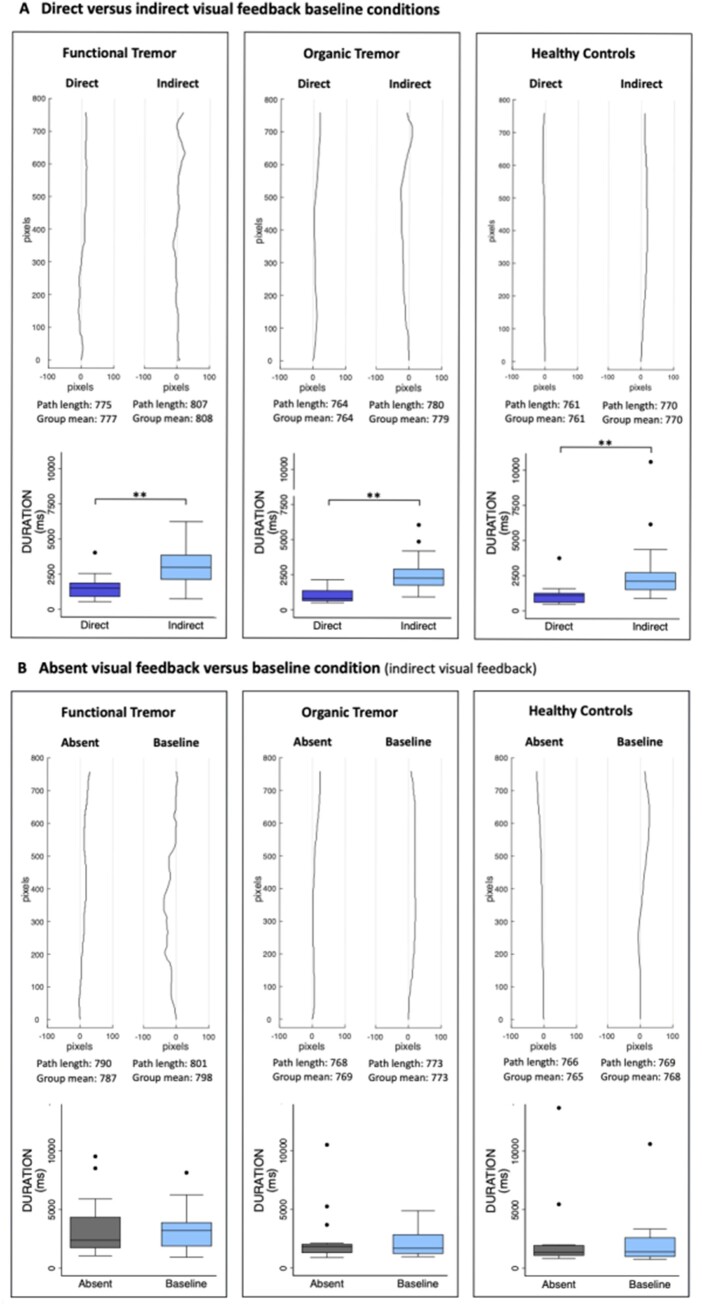
Figure 2.
Typical trajectories and group durations. (A) For the direct versus indirect visual feedback conditions. (B) For the absent visual feedback versus baseline conditions. For each comparison, for which there was a statistically significant difference in path length, a typical trajectory for each condition is plotted, together with the group average durations. Note that 100 pixels correspond to 3 cm. The direct path between the start and target is 760 pixels, which corresponds to 22.8 cm. The change in tremulousness is difficult to appreciate in these small figures. Real size trajectories of the functional tremor group are provided in Supplementary Figs 1 and 2. For the durations, statistically significant differences are marked by asterisks: *P < 0.05, **P < 0.001. The box-and-whisker plots indicate the median, 25th and 75th percentile, upper and lower adjacent values and outliers.

