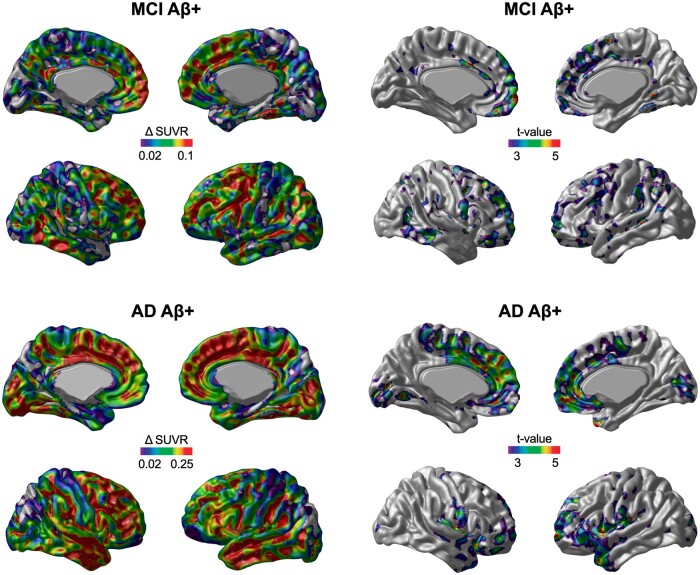
Figure 2.
The area and magnitude of longitudinal 18F-MK-6240 SUVR accumulation in MCI and patients with Alzheimer’s disease dementia. The brain images (left) show the mean annual rate (Δ) of change in the 18F-MK-6240 SUVR overlaid on a structural MRI template. The brain images (right) show the results of the voxel-wise paired t-test comparison (FWE rate corrected for multiple comparisons at P < 0.05) between the baseline and follow-up 18F-MK-6240 SUVR scans.

