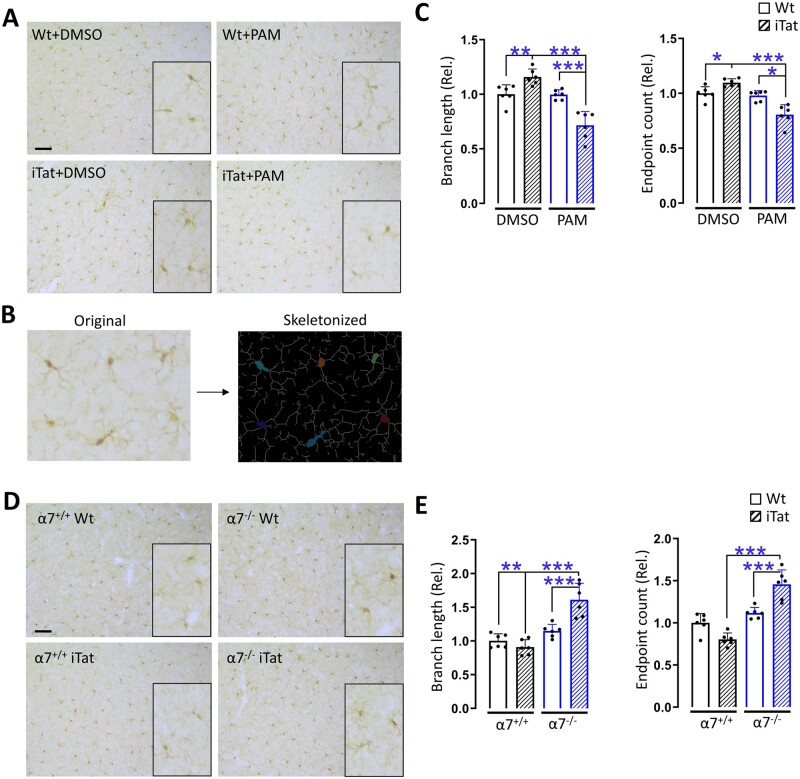
Figure 6.
Microglia activation by PAM in cortex of iTat mice and α7−/− iTat mice. (A) The brains from Fig. 1 were dissected, fixed, sectioned and stained for Iba-1. Microglia morphologies were skeletonized (B), and the total length and end points of branches in three brain regions including prefrontal, parietal and occipital cortex were quantified and averaged from three sections of each mouse (n = 6/group, 3 males and 3 females) (C). Similarly, the brains from Fig. 2 were processed and stained for Iba-1 (D), skeletonized and quantitated (E). The WT+DMSO group was used as a reference and set at 1. P < 0.05 was considered significant and is denoted with an asterisk; **P < 0.01 and ***P < 0.001 were considered highly significant. Scale bars = 200 µm (A).

