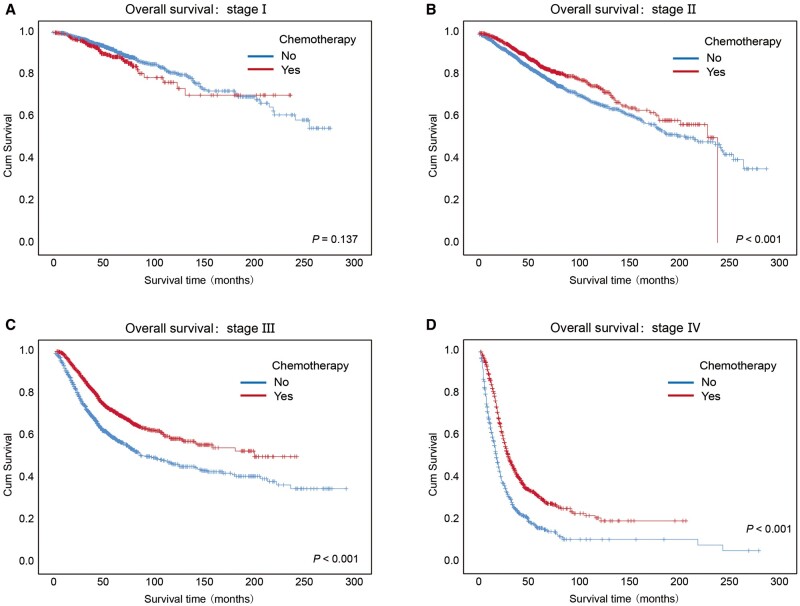
Figure 3.
Kaplan–Meier overall survival curves of CRC patients who received chemotherapy or no chemotherapy at different clinical stages. Kaplan–Meier overall survival curves of the CRC patients received chemotherapy or no chemotherapy at different clinical stages, including (A) stage I, (B) stage II, (C) stage III, and (D) stage IV. Log-rank analysis was used to test for significance.

