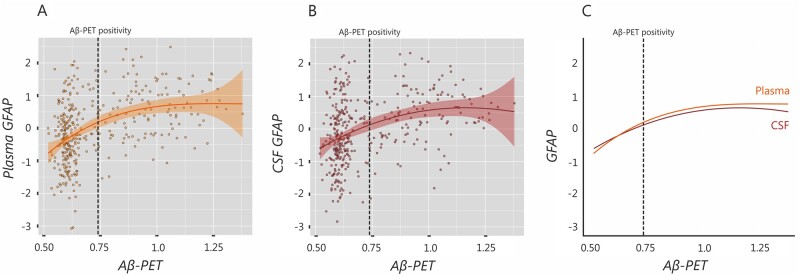
Figure 4.
Plasma GFAP shows early increases with amyloid-β-PET burden. Spline models showing the trajectories for (A) plasma GFAP and (B) CSF GFAP using global amyloid-β-PET SUVR as a proxy for time. Both models were significant; however, when the splines of plasma and CSF GFAP were compared, plasma GFAP showed steeper initial increases, overcoming CSF GFAP levels even before amyloid-β-PET positivity (C). Aβ = amyloid-β.

