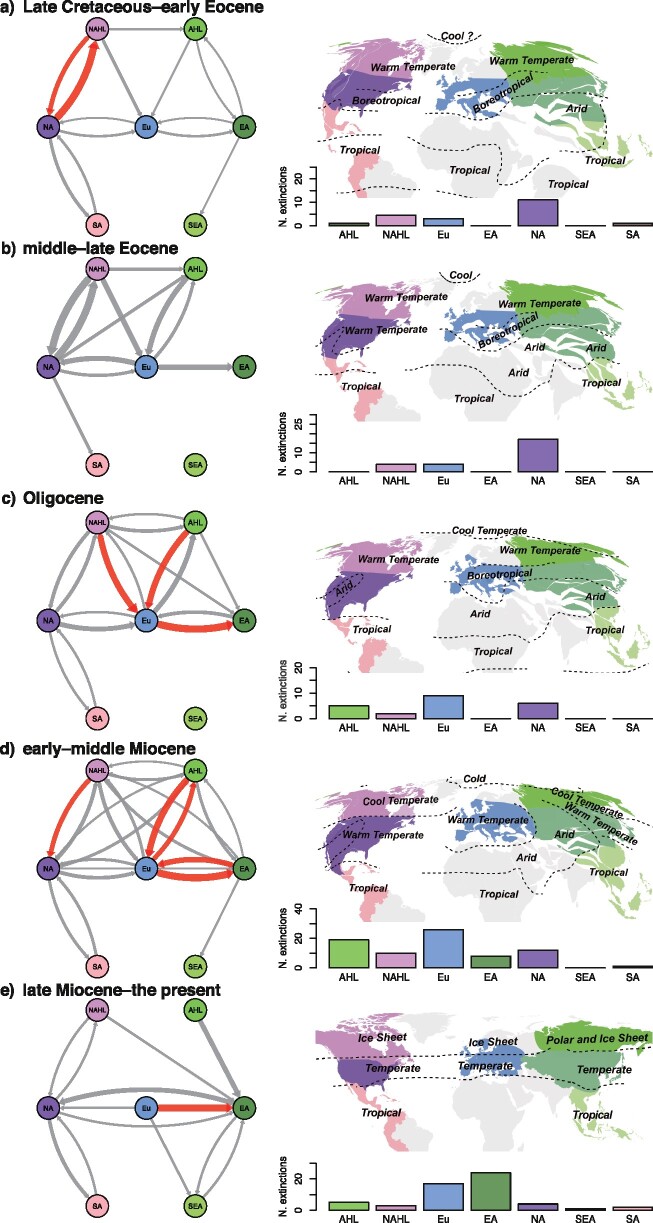
Figure 5.
Dispersal and extinction events of extant and extinct species of Juglandaceae across five time bins. a) Late Cretaceous–early Eocene, b) middle–late Eocene, c) Oligocene, d) early–middle Miocene, and e) late Miocene–the present. Networks depict dispersal events during different time bins. Bar plots show the number of local extinction events during different time bins. The paleoclimate maps for a–d) are modified from Boucot et al. (2013). The paleoclimate map for e) is modified from Ray and Adams (2001). Region abbreviations: AHL  Asian High Latitudes; NAHL
  North American High Latitudes; Eu
  Europe; EA
  East Asia; NA
  North America; SEA
  Southeast Asia; SA
  South America. The thickness of the arrows represents the number of dispersal events. Red arrows indicate that the dispersal events are more than or equal to four events.

