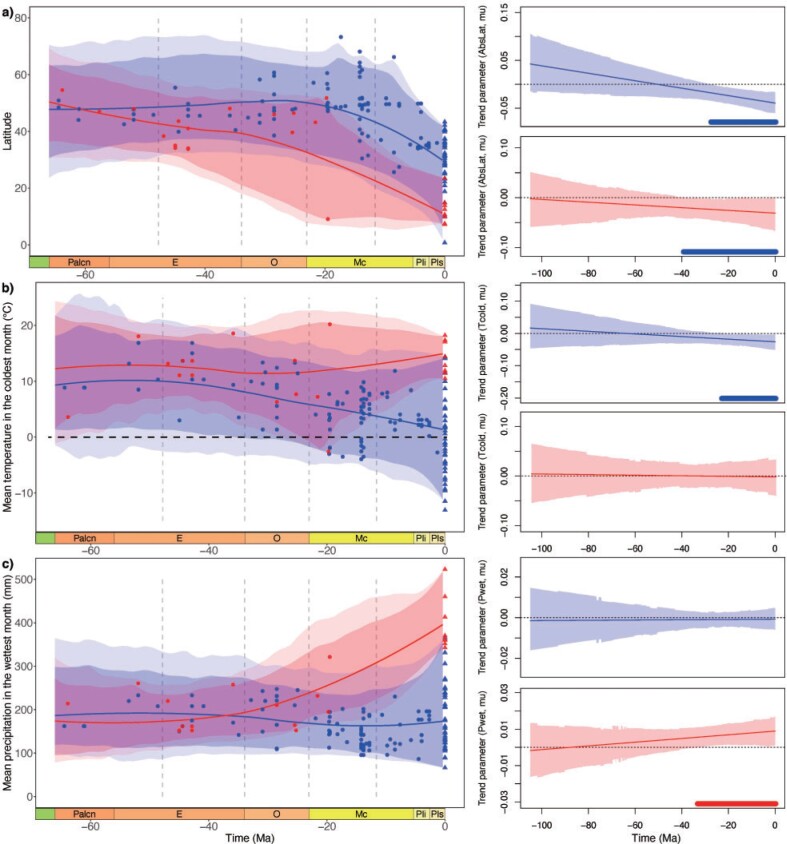
Figure 7.
Latitude and climate niche evolution of mean temperature in the coldest month and mean precipitation in the wettest month for subfamilies Juglandoideae and Engelhardioideae during the Cenozoic. Geological time abbreviations: LC  Late Cretaceous; Palcn
  Paleocene; E
  Eocene; O
  Oligocene; Mc
  Miocene; Pli
  Pliocene; Pls
  Pleistocene. Lines indicate mean values and the shaded areas represent 95% and 99% credible intervals. Blue represents the clade of Juglandoideae and the red represents Engelhardioideae. Circles represent fossil occurrences and the triangles represent extant species. The frost tolerance is shown below the dotted black line (0
 in (b). The right column shows the estimated trend parameters for subfamilies Juglandoideae (blue) and Engelhardioideae (red). Thin lines indicate mean values and the shaded areas represent 95% credible intervals. Bold lines at the bottom of the plots indicate the periods of time with significantly negative (blue) or positive (red) estimated trends. AbsLat
  Absolute Latitude; Tcold
  mean temperature of the coldest month; Pwet
  mean precipitation of the wettest month.

