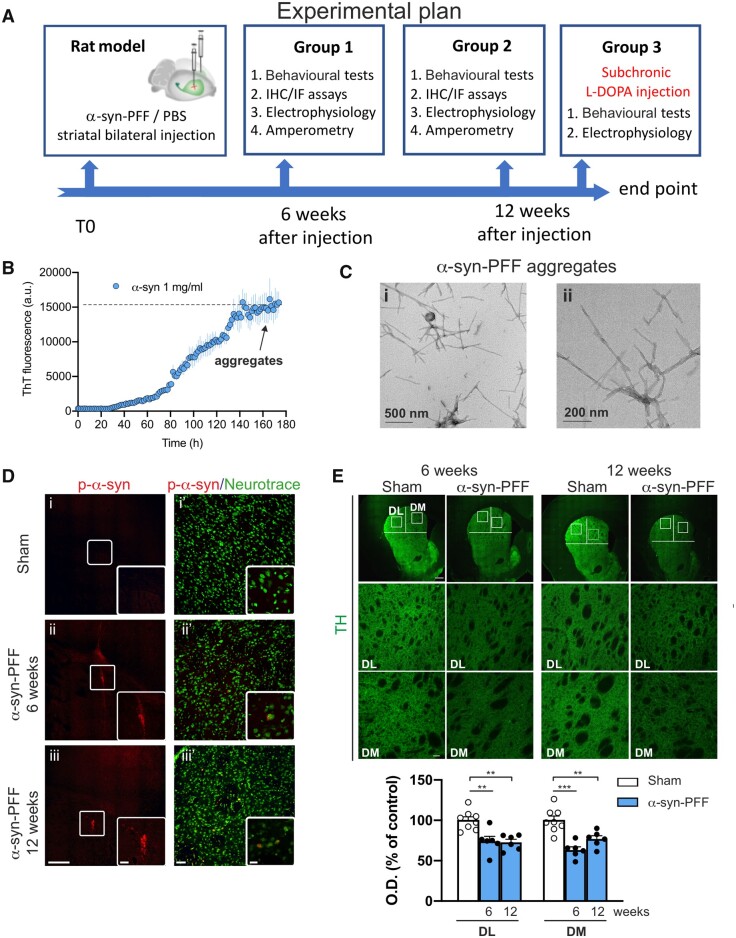
Figure 1.
Graphical representation of the general experimental plan; procedure for aggregating α-syn and time-dependent immunofluorescence striatal characterization of the α-syn-PFF-injected rat model. (A) Scheme representing the timeline of the experimental procedures and the organization of the experimental groups. Rats were injected with α-syn-PFF or PBS at 7–8 weeks of age. After injection, the rats were enrolled in behavioural tests and then used for immunofluorescence (IF), electrophysiological or amperometric experiments. (B) Time-course graph of α-syn (1 mg/ml) aggregation in vitro, as increase in thioflavin T fluorescent staining. Note that after 160 h incubation, complete stable aggregates of α-syn (preformed fibrils, α-syn-PFF) are formed. (C) Transmission electron microscopy images showing α-syn-PFF at different magnifications before sonication. (D) Representative coronal brain images (i–iii) of p-α-syn immunofluorescence in the striatum of (i) sham (PBS-injected) and α-syn-PFF-injected rats at (ii) 6 weeks- and (iii) 12 weeks-post-injection, showing the site of α-syn-PFF injections (20×, scale bar = 500 µm). The insets show higher magnification (digital zoom) of α-syn-positive aggregates (scale bar = 100 µm). Representative images (i′–iii′) of p-α-syn (red)/NeuroTraceTM 455 (green) double immunolabelling in striatum of (i′) sham and α-syn-PFF-injected rats at (ii′) 6 weeks- and (iii′) 12 weeks-post-injection (20× objective, scale bar = 50 µm). The insets show examples of higher magnification (40× with 2× digital zoom, scale bar = 20 µm). (E) Representative images of coronal brain sections showing reduced TH immunoreactivity in the dorso-lateral (DL) and dorso-medial (DM) striatum of α-syn-PFF-injected rats (20×, scale bar = 500 µm). The second and third row show the DL and DM striatal regions at higher magnification (×20, scale bar = 50 µm) of the square areas outlined. The graph shows quantification of the TH immunoreactivity in the DL and DM striatum of sham- and α-syn-PFF-injected rats. Note the significant reduction of the TH staining both in the DL and DM striatum of 6- and 12-week-injected rats with respect to shams. Data are presented as mean ± SEM of the optical density, as a percentage of the control. Sham n = 8; α-syn-PFF 6 weeks n = 6; α-syn-PFF 12 weeks n = 6; **P < 0.01, ***P < 0.001. One-way ANOVA, followed by Bonferroni’s post hoc test.

