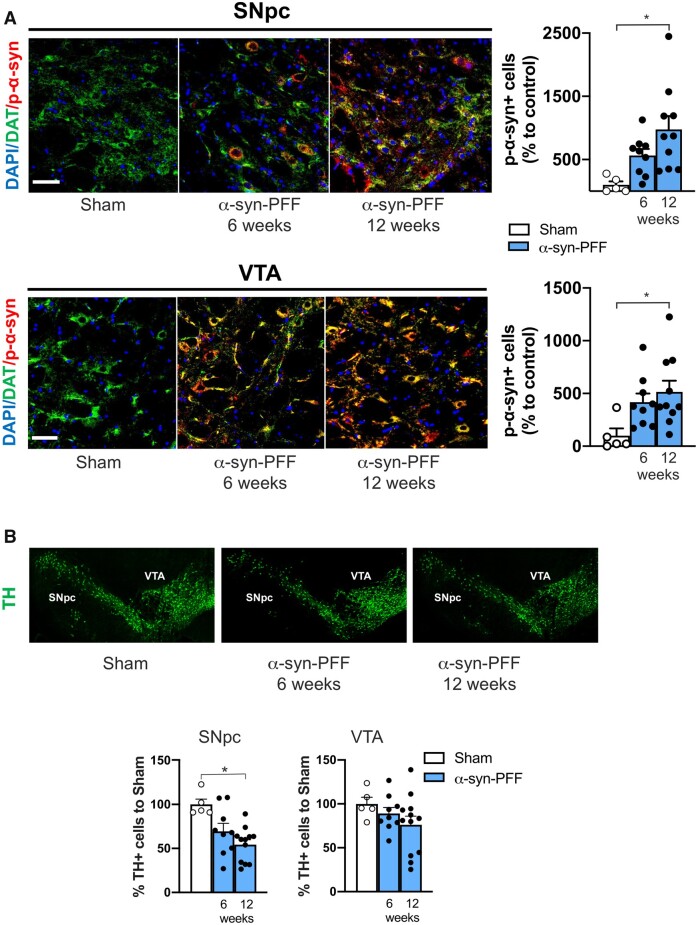
Figure 2.
Striatal α-syn-PFF injection leads to a time-dependent increase of p-α-syn in the SNpc and VTA with parallel loss of SNpc TH-positive neurons. (A) Representative photomicrographs of SNpc (top) and VTA sections (bottom) of Sham- (left) and α-syn-PFF-injected rats, at 6 (middle) and 12 weeks after the injection (right), showing DAPI, DAT and p-α-syn triple co-immunofluorescence staining. Note that p-α-syn is mainly detected in dopaminergic neurons, as revealed by DAT immunostaining (20× magnification, 2× digital zoom, scale bar = 100 μm). Graphs showing the counting of p-α-syn-positive cells of the SNpc (top) and VTA (bottom). Note the significant increase in the number of p-α-syn-positive neurons 12 weeks after α-syn-PFF injection compared with the sham (SNpc: sham n = 5; α-syn-PFF 6 weeks n = 9; α-syn-PFF 12 weeks n = 10. VTA: sham n = 5; α-syn-PFF 6 weeks n = 9; α-syn-PFF 12 weeks n = 10). (B) Representative photomicrographs sections, including the SNpc and VTA regions, of sham- (left) and α-syn-PFF-injected rats at 6 (middle) and 12 weeks (right) after injection, showing different degrees of TH immunofluorescence. Left graph shows the number of TH-positive neurons counted in the SNpc of α-syn-PFF-injected rats at 6 and 12 weeks post-injection (as a % of counts in shams). Note the significant reduction of TH-positive neurons in the SNpc of α-syn-PFF 12 weeks after the striatal injection (sham n = 5; α-syn-PFF 6 weeks n = 9; α-syn-PFF 12 weeks n = 12). The right graph shows the number of TH-positive neurons counted in the VTA of α-syn-PFF-injected rats at 6 and 12 weeks post-injection (as a % of counts in shams). Note that no significant differences between groups were found in the VTA (sham n = 5; α-syn-PFF 6 weeks n = 9; α-syn-PFF 12 weeks n = 12. *P < 0.05. One-way ANOVA followed by Bonferroni’s post hoc test).

