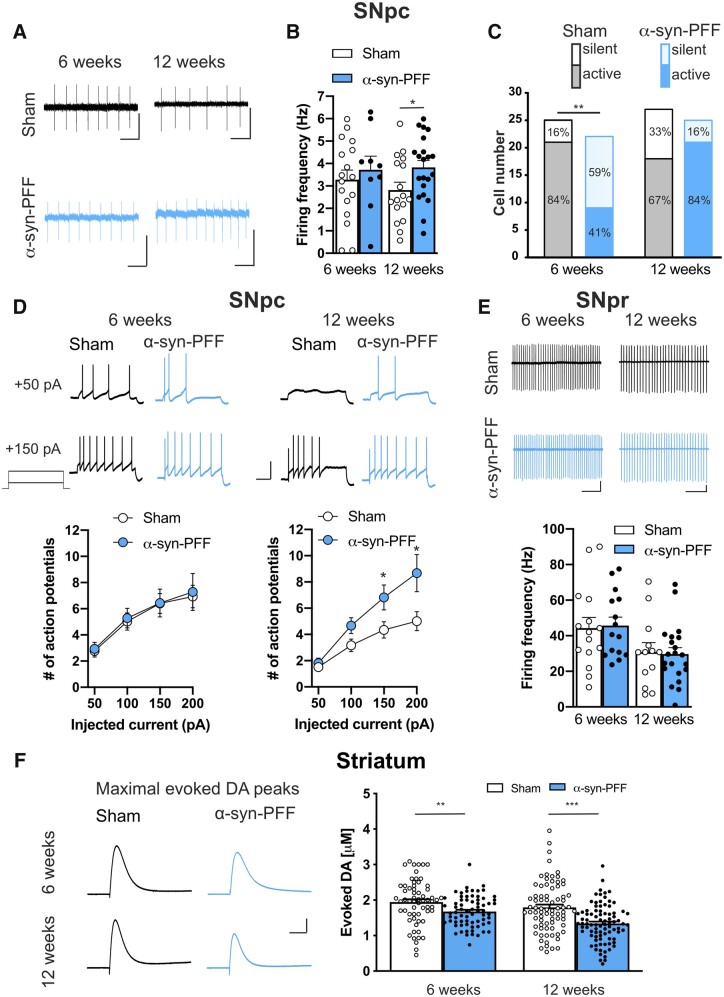
Figure 4.
Electrical firing properties of nigral neurons and constant potential amperometry of striatal DA in slices of α-syn-PFF-injected and sham rats. (A) Representative traces of spontaneous firing recorded in cell-attached patch-clamp in DA neurons of SNpc in sham (black traces) and α-syn-PFF-injected (cyan traces) animals at 6 (left) or 12 weeks (right) after injection. Scale bars = 20 pA, 0.5 s. (B) Graph of the mean spontaneous firing frequency of active DA neurons in SNpc recorded from sham and α-syn-PFF rats at 6 and 12 weeks post-injection, showing a significative increase in the mean frequency in neurons of 12 weeks α-syn-PFF-injected rats respect to the sham animals (6 weeks: sham n = 17, α-syn-PFF n = 9; 12 weeks: sham n = 17, α-syn-PFF n = 21). Values are expressed as mean ± SEM, *P < 0.05, Student’s t-test. (C) Bar graph showing the number of recorded DA cells and the percentage of silent versus active neurons in the SNpc of sham (grey) and α-syn-PFF-injected (cyan) rats at 6 or 12 weeks post-surgery (active cells: 6 weeks, sham 21/25, α-syn-PFF 9/22; 12 weeks, sham 18/27, α-syn-PFF 21/25, **P = 0.002, χ2 test. (D) Representative traces of action potentials discharge in response to +50 and +150 pA current steps (top) and graphs of the number of action potentials (bottom) of SNpc DA neurons of sham and α-syn-PFF rats at 6 or 12 weeks after injection. Data are expressed as mean ± SEM, *P < 0.05, Student’s t-test. Scale bars = 40 mV, 0.5 s. (E) Representative traces of spontaneous firing recorded in GABAergic neurons of SNpr in sham (black traces) and α-syn-PFF (cyan traces) animals at 6 or 12 weeks post-injection. Scale bars = 25 pA, 250 ms. Graph of the mean spontaneous firing frequency of GABAergic neurons of the SNpr showing no differences between sham and α-syn-PFF rats at both 6 and 12 weeks post-injection (6 weeks: sham n = 15, α-syn-PFF n = 15; 12 weeks: sham n = 13, α-syn-PFF n = 21). (F) Representative traces (left) and graph (right) of constant potential amperometry of electrically-stimulated DA release performed in slices containing the dorsal striatum of sham and α-syn-PFF animals at 6 or 12 weeks after injection (6 weeks: sham n = 62, α-syn-PFF n = 70; 12 weeks: sham n = 77, α-syn-PFF n = 87). Data are expressed as mean ± SEM, **P < 0.01; ***P < 0.001, Student’s t-test. Scale bars = 50 pA, 0.2 s.

