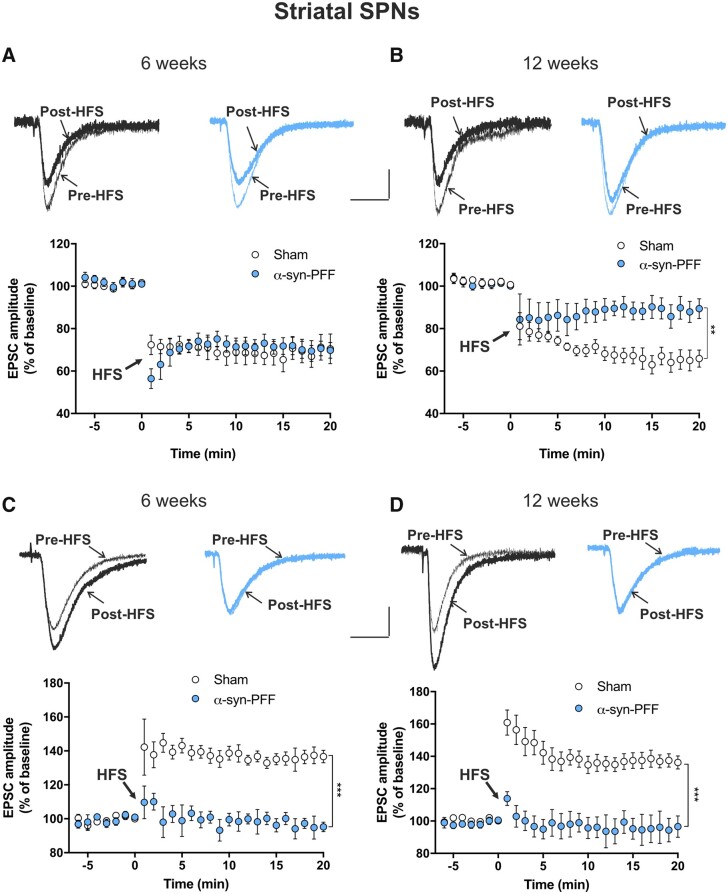
Figure 5.
Time course of LTD and LTP of striatal spiny projection neurons of α-syn-PFF- and PBS-injected rats at 6 and 12 weeks post-injection. (A and B) Representative traces of superimposed evoked EPSCs recorded from a SPN before and 20 min after a high-frequency stimulation (HFS) protocol in sham (black traces) and α-syn-PFF-injected (cyan traces) animals at 6 weeks (A, top) or 12 weeks (B, top) from injection. The time-course graphs show the mean EPSC amplitudes, as a percentage of the baseline, of SPNs recorded before and for 20 min after an HFS (LTD protocol) in both sham and α-syn-PFF rats at 6 weeks (A) and 12 weeks (B) post-surgery. Note the reduced LTD in α-syn-PFF rats at 12 weeks post-injection (6 weeks: sham n = 6, α-syn-PFF n = 7; 12 weeks: sham n = 8, α-syn-PFF n = 9), **P < 0.01, two-way ANOVA. (C and D) Representative traces of superimposed evoked EPSCs recorded from a SPN in a Mg2+-free Krebs solution before and 20 min after an HFS protocol, in sham (black traces) and α-syn-PFF (cyan traces) animals at 6 weeks (C, top) or 12 weeks (D, top) from injection. The time-course graphs show the mean EPSC amplitudes, as a percentage of the baseline, of SPNs recorded before and for 20 min after the HFS (LTP protocol) in both sham and α-syn-PFF rats at 6 weeks (C) and 12 weeks (D) post-surgery. Note the absence of LTP in SPNs of α-syn-PFF rats at both 6 and 12 weeks post-surgery (6 weeks: sham n = 9; α-syn-PFF n = 13; 12 weeks: sham n = 9; α-syn-PFF n = 9), ***P < 0.001, two-way ANOVA. Scale bars = 100 pA, 20 ms.

