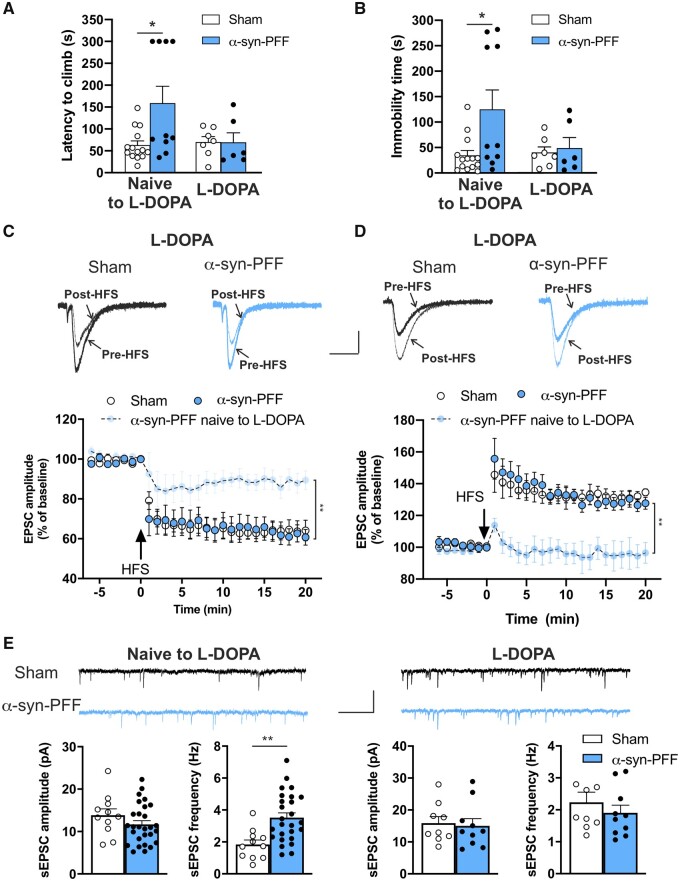
Figure 6.
Effect of subchronic l-DOPA treatment on synaptic spontaneous currents, synaptic plasticity and motor performance of rats at 12 weeks post α-syn-PFF- or PBS-injection. (A and B) Graphs of the performance of α-syn-PFF- and PBS-injected rats treated with l-DOPA in the grid-walking task show that the latency to climb (A) and the immobility time (B) at 12 weeks after α-syn-PFF injection are not significantly different, unlike the observations of α-syn-PFF and sham rats that were naïve to l-DOPA (naïve to l-DOPA: sham n = 14, α-syn-PFF n = 10, *P < 0.05; l-DOPA: sham n = 7, α-syn-PFF n = 6, one-way ANOVA followed by Bonferroni’s post hoc test). (C) Representative superimposed evoked EPSCs recorded from a SPN before and 20 min after a high-frequency stimulation (HFS) protocol in sham (black traces) and α-syn-PFF (cyan traces) animals at 12 weeks from injection. Scale bar 100 pA, 20 ms. Time-course graphs showing the mean EPSC amplitude, as a percentage of the baseline, of SPNs recorded before and for 20 min after an HFS (LTD protocol) in both sham and α-syn-PFF rats at 12 weeks post-surgery. Note the restored LTD in α-syn-PFF rats treated with l-DOPA (naïve to l-DOPA: α-syn-PFF n = 9; l-DOPA: sham n = 8; α-syn-PFF n = 8), **P < 0.01, two-way ANOVA. (D) Representative superimposed evoked EPSCs recorded from an SPN before and 20 min after the HFS protocol in Mg2+-free external solution in sham (black traces) and α-syn-PFF (cyan traces) animals at 12 weeks from injection. Scale bar = 100 pA, 20 ms. Time-course graphs show the mean EPSC amplitude, as percentage of the baseline, of SPNs recorded before and for 20 min after the HFS (LTP protocol) in both l-DOPA-treated sham and α-syn-PFF rats at 12 weeks post-surgery. Note that, after the l-DOPA treatment, the impaired LTP observed in SPNs of α-syn-PFF rats at 12 weeks post-surgery was completely restored (naïve to l-DOPA: α-syn-PFF n = 9; l-DOPA: sham n = 7; α-syn-PFF n = 11, ***P < 0.001, two-way ANOVA). (E) Representative traces of sEPSCs of SPNs of sham and α-syn-PFF rats at 12 weeks post-injection in the absence (left) or presence (right) of l-DOPA treatment. Scale bar = 20 pA, 1 s. Graphs of the sEPSC mean amplitude (left) and frequency (right) of SPNs recorded from sham and α-syn-PFF rats at 12 weeks post-injection in the presence or in the absence of l-DOPA treatment. Note that the increase of sEPSC frequency in α-syn-PFF rats is completely reverted by l-DOPA treatment (naïve to l-DOPA: sham n = 11; α-syn-PFF n = 28. l-DOPA: sham n = 9; α-syn-PFF n = 10), **P < 0.01, Student’s t-test.

