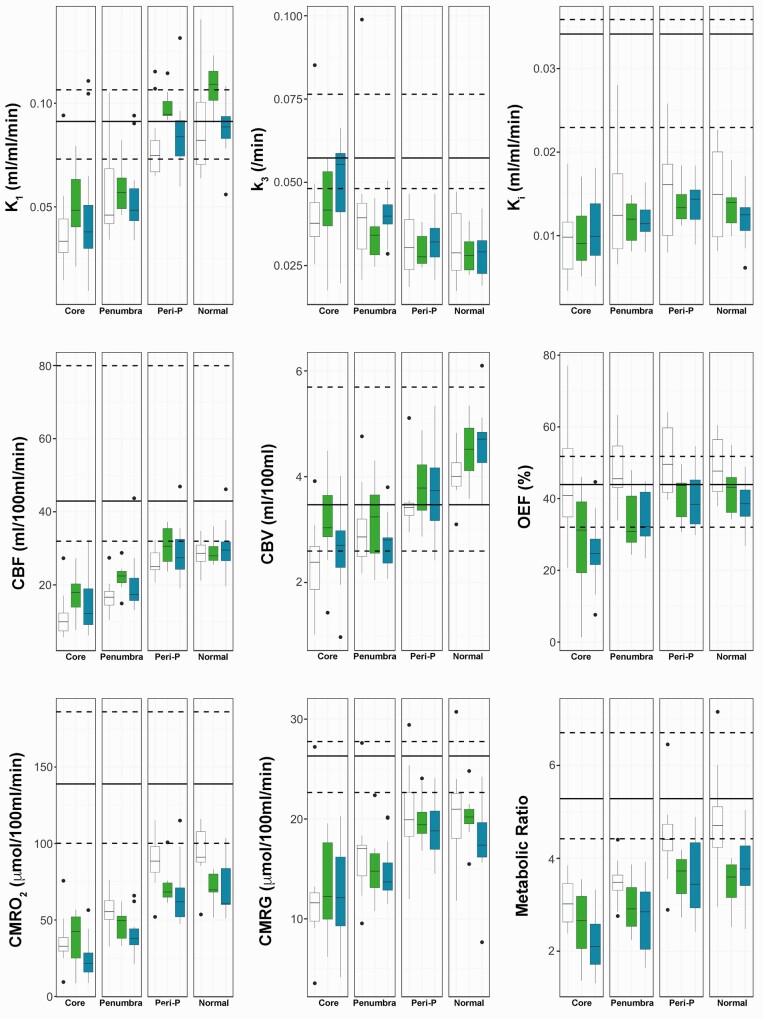
Figure 2.
Spatial and temporal pattern of metabolic parameters. Box-and-whisker plots of the 18F-FDG kinetic parameters (K1, k3, Ki), CBF, CBV, OEF, CMRO2, CMRG, and CMRO2/CMRG metabolic ratio for the different regions of interest in patients within 24 h (Early; white), Days 2–5 (Intermediate; green) and Days 6–12 (Late, blue) post-injury. The horizontal line within each box denotes the median value, the lower and upper boundaries the 25th and 75th centile, the vertical lines the 10th and 90th centile, and the closed circles outlying data-points. The solid and dashed black lines represent the median and the full range of values for healthy volunteers, respectively. For the metabolic ratio the median and range in healthy volunteers is calculated from two different cohorts of subjects.

